The “Analytics” section can help you to keep track of and to analyze the effects of campaigns.
Populizr Analytics show you clicks-per-social network for each blog post and variation. We even show you your reader’s geographical location. You can see analytics By Blog Post and By Demographics. To do that, click on the Analytics menu in the left sidebar and, from the drop-down, choose the By Blog Post item. Here, you have a timeline of social posting per social network. You can modify the preview in the toolbar above the graph. Choose between area preview, line preview, bars or stacked preview.
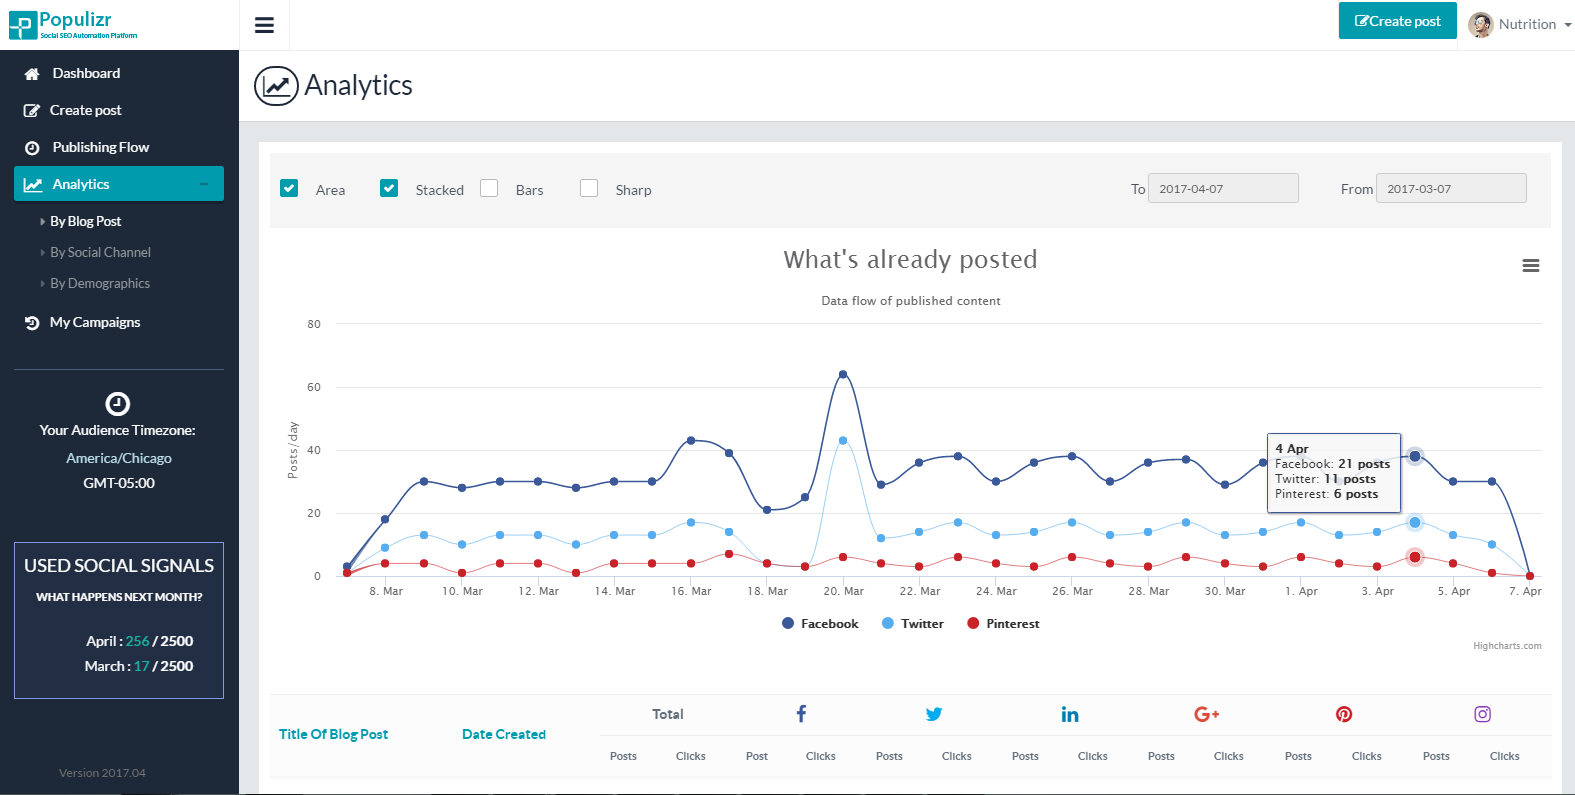
Also, you can modify the time period for the analytics display. If you click on the name of a network, you isolate the one you have clicked. In this way you will narrow the analytics for a specific social network posting.

There is also a list of all social signals you have made and the number of the clicks-per-social network.
Populizr enables you to see the intensity per country. Click on Analytics on the left sidebar and choose By Demographics. Here, you’ll see a map with information about your reader’s location. On the toolbar above the map, modify the time period and choose a name of a blog post for which you want to see analytics. In this section, Populizr enables you to see the demographics even per social network.

Recent Comments